Home › Short-term rental deal analyzer
Short-term rentals · investingShort-term rental deal analyzer for Airbnb & VRBO (buy or rental arbitrage)
Will this Airbnb actually pay? Find out before you buy the property or sign the lease. Enter the deal, your expected nightly rate and occupancy month by month, and what each stay and each month costs you, and this workbook shows revenue, NOI, cash flow, cash-on-cash return, cap rate, DSCR, payback and your break-even occupancy, compares it with renting the same place long-term, and stress-tests what happens if occupancy drops or rates fall. Two ways to run a deal: Buy (purchase price, down payment, closing costs and a mortgage, US monthly or Canadian semi-annual compounding) or Rent (arbitrage), where you lease from an owner and host it. For Airbnb, VRBO and Booking.com hosts and investors in the US, Canada and elsewhere, in Excel and Google Sheets.
Instant digital download (.xlsx). No macros, no subscription.
Included in both complete bundles: get this spreadsheet plus 18 more in the Complete Landlord Bundle (US) (CA$79.99, save about 75%) or the Canadian Landlord Bundle (T776) (CA$81.99, save about 74%).
What you get
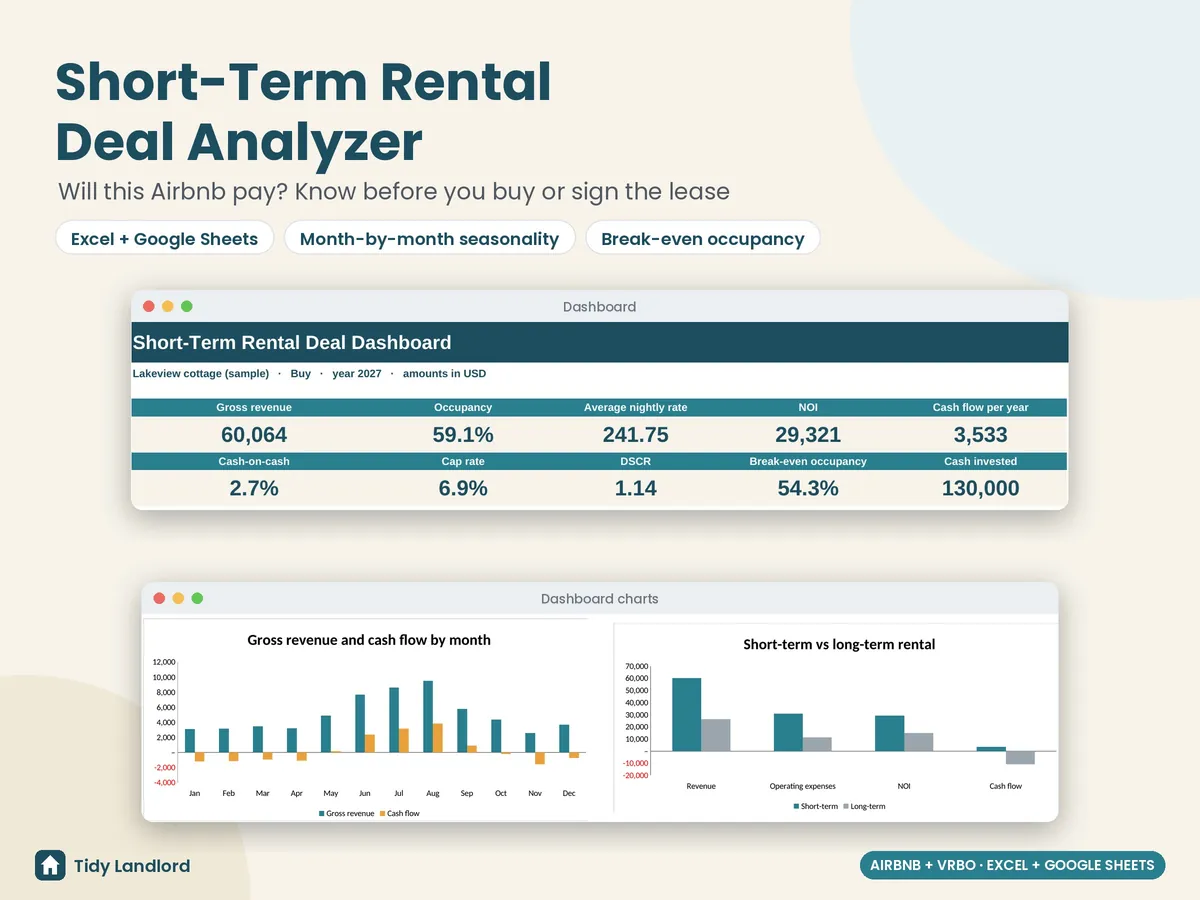
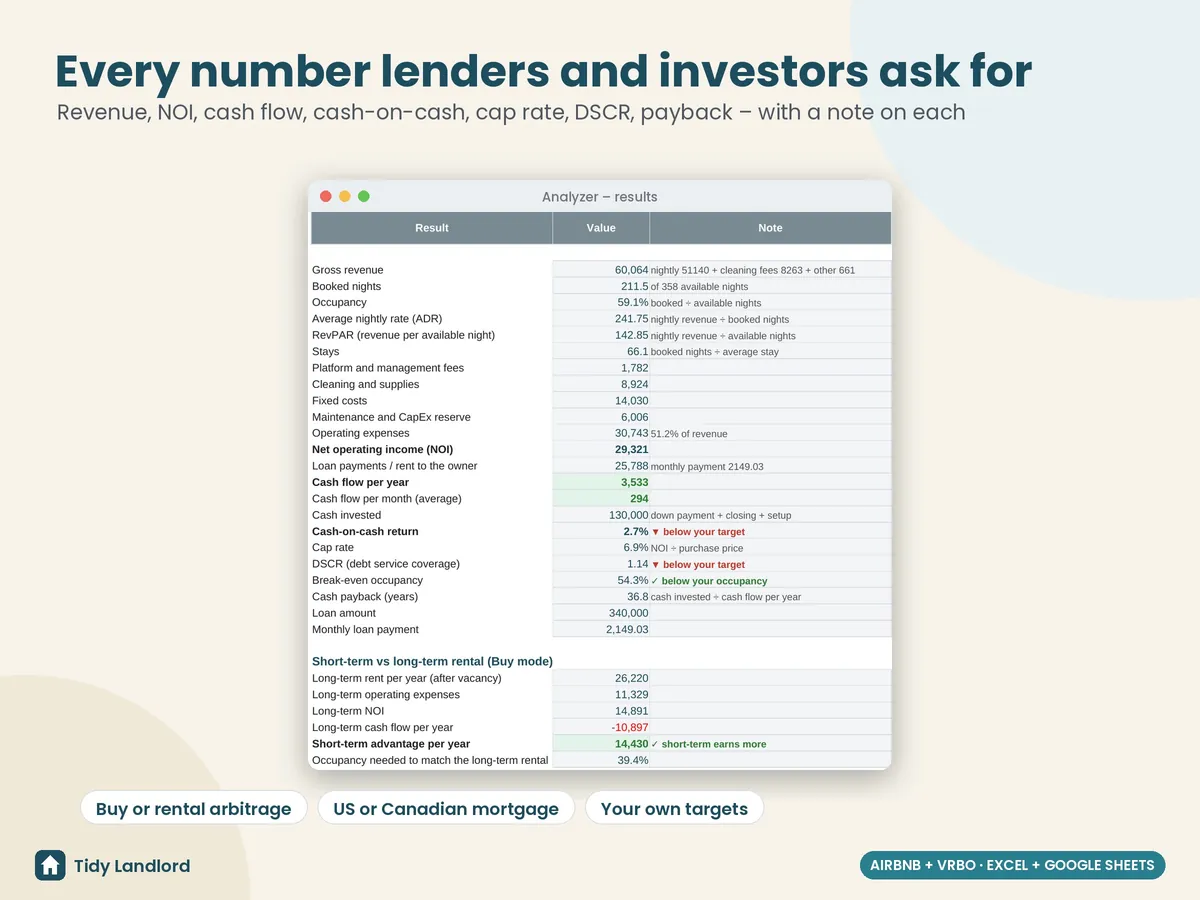
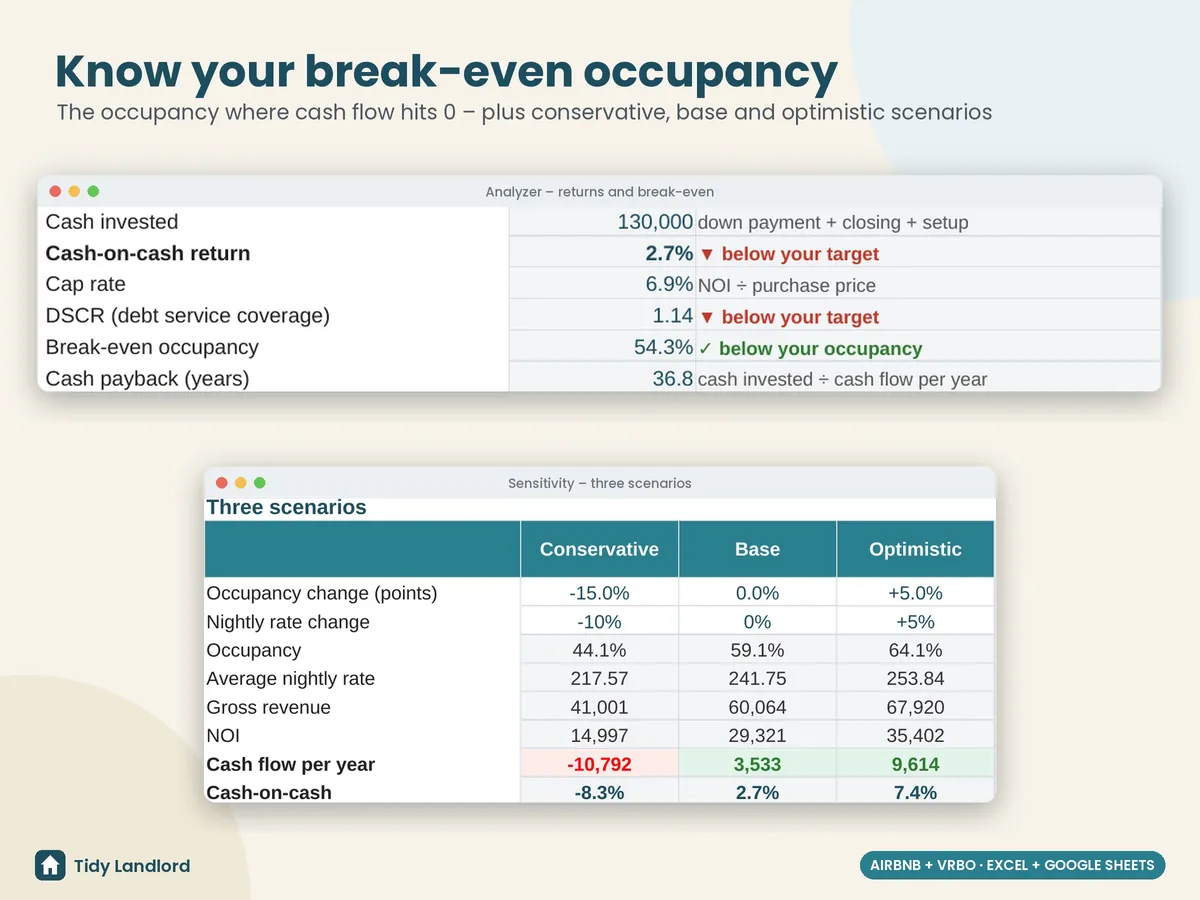
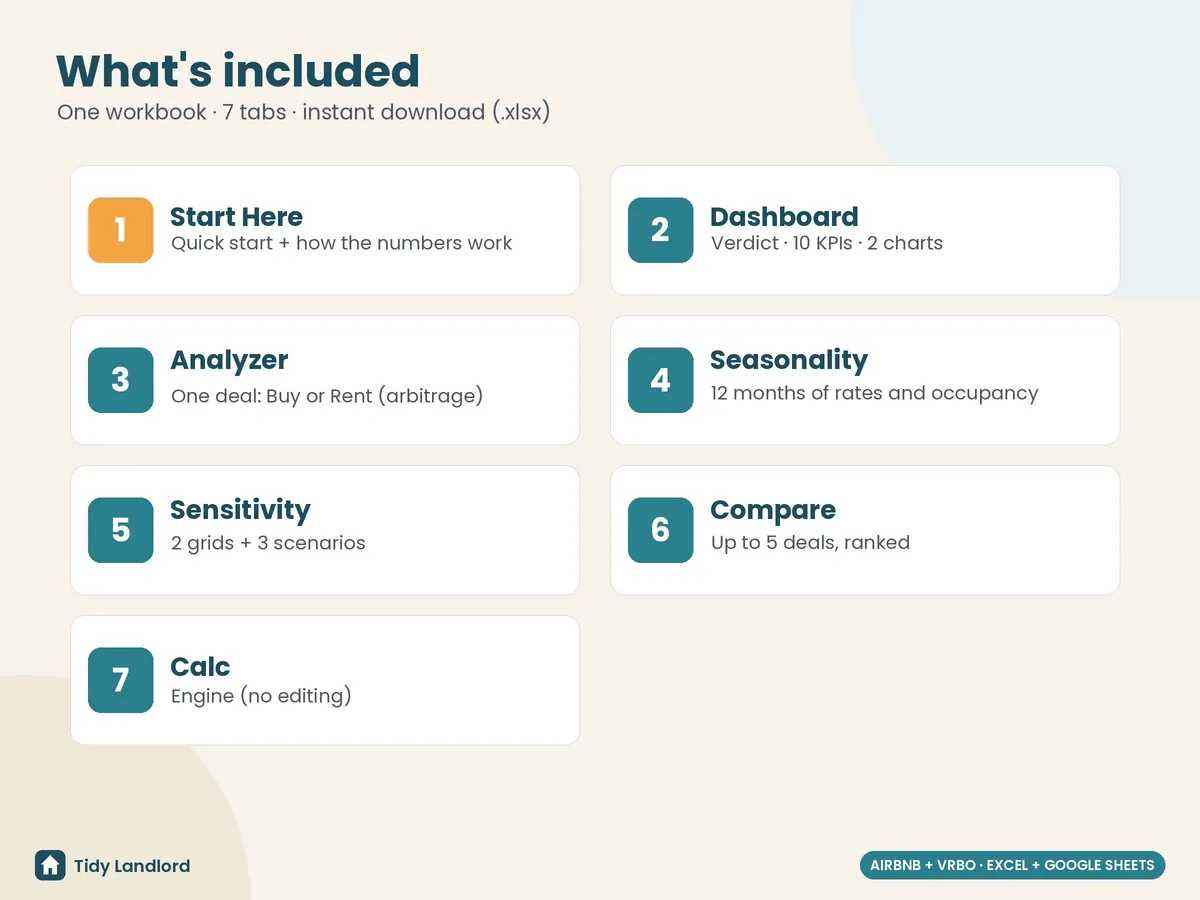
- An analyzer with one deal on one page: purchase and loan (or rent to the owner), renovation, furnishing and setup, average stay, the cleaning fee you charge and other income per stay, platform fee %, management %, cleaning and supplies per stay, fixed monthly costs, property tax and licence, maintenance and CapEx reserves, and your targets. Results: gross revenue, booked nights, occupancy, ADR, RevPAR, stays, every cost line, NOI, cash flow per year and per month, cash invested, cash-on-cash, cap rate, DSCR, break-even occupancy, cash payback and the loan payment, each checked against your target
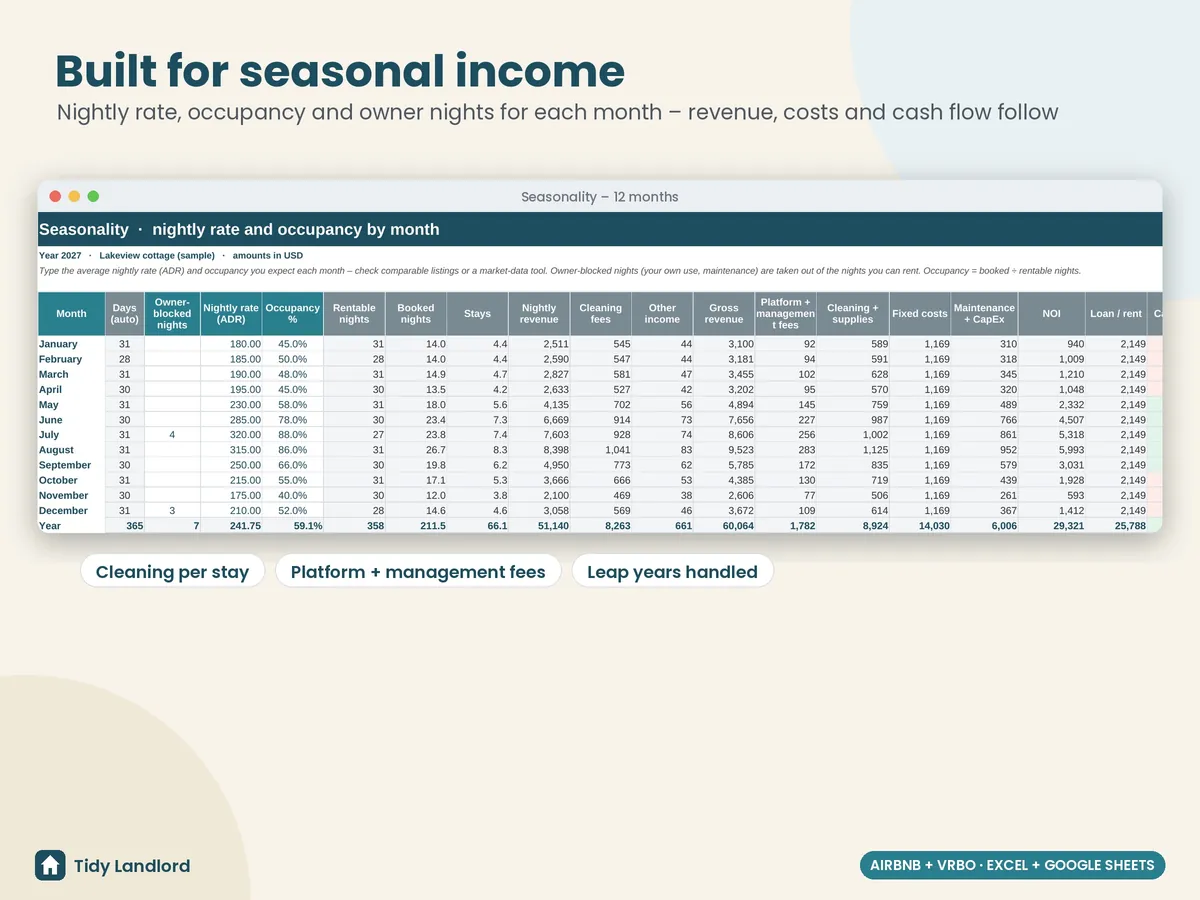
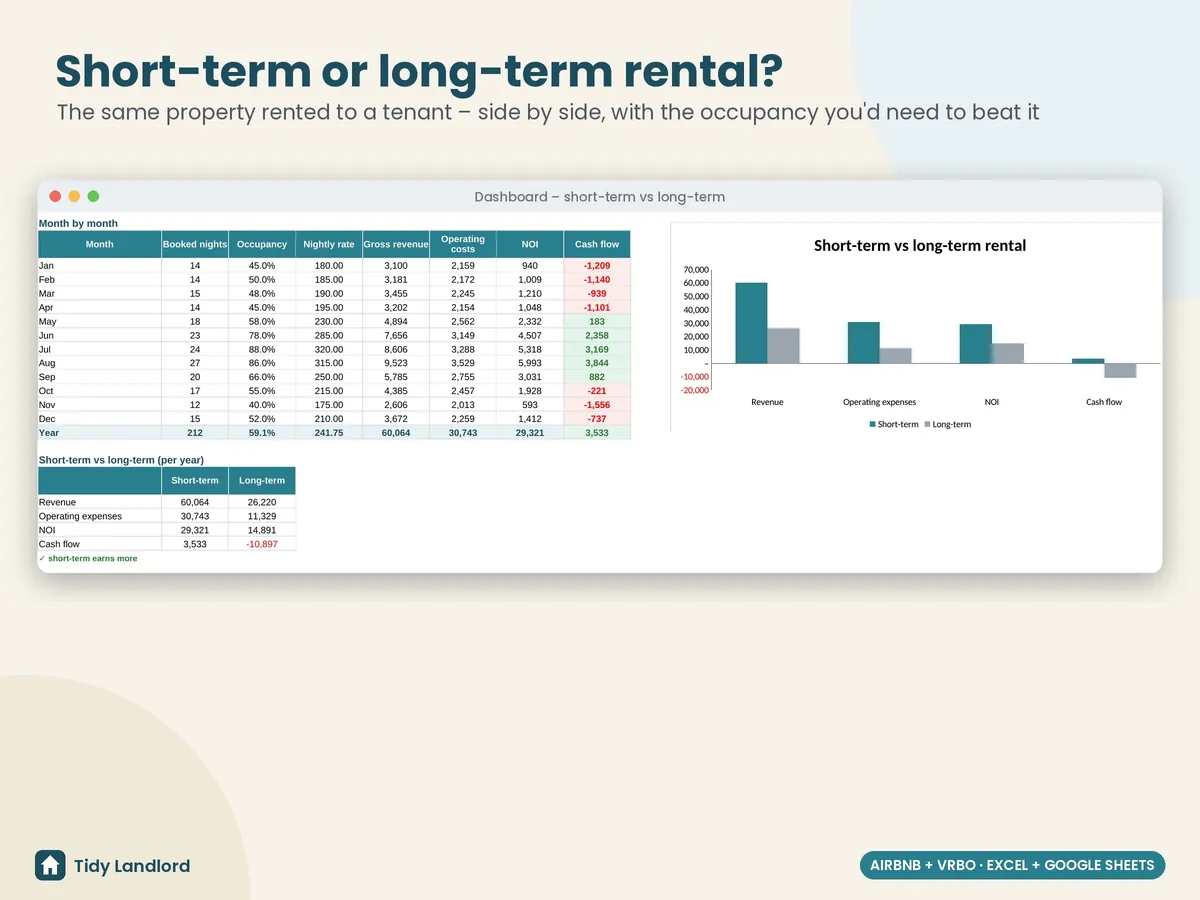
- Seasonality: 12 months of nightly rate, occupancy and owner-blocked nights, with days per month from the year (leap years handled) and every revenue and cost line worked out for each month and the year
- Short-term vs long-term: the same property rented to a tenant (your long-term rent, vacancy, management and maintenance %, plus the property tax, insurance and HOA you'd still pay), how much more or less short-term earns, and the occupancy you'd need to match it
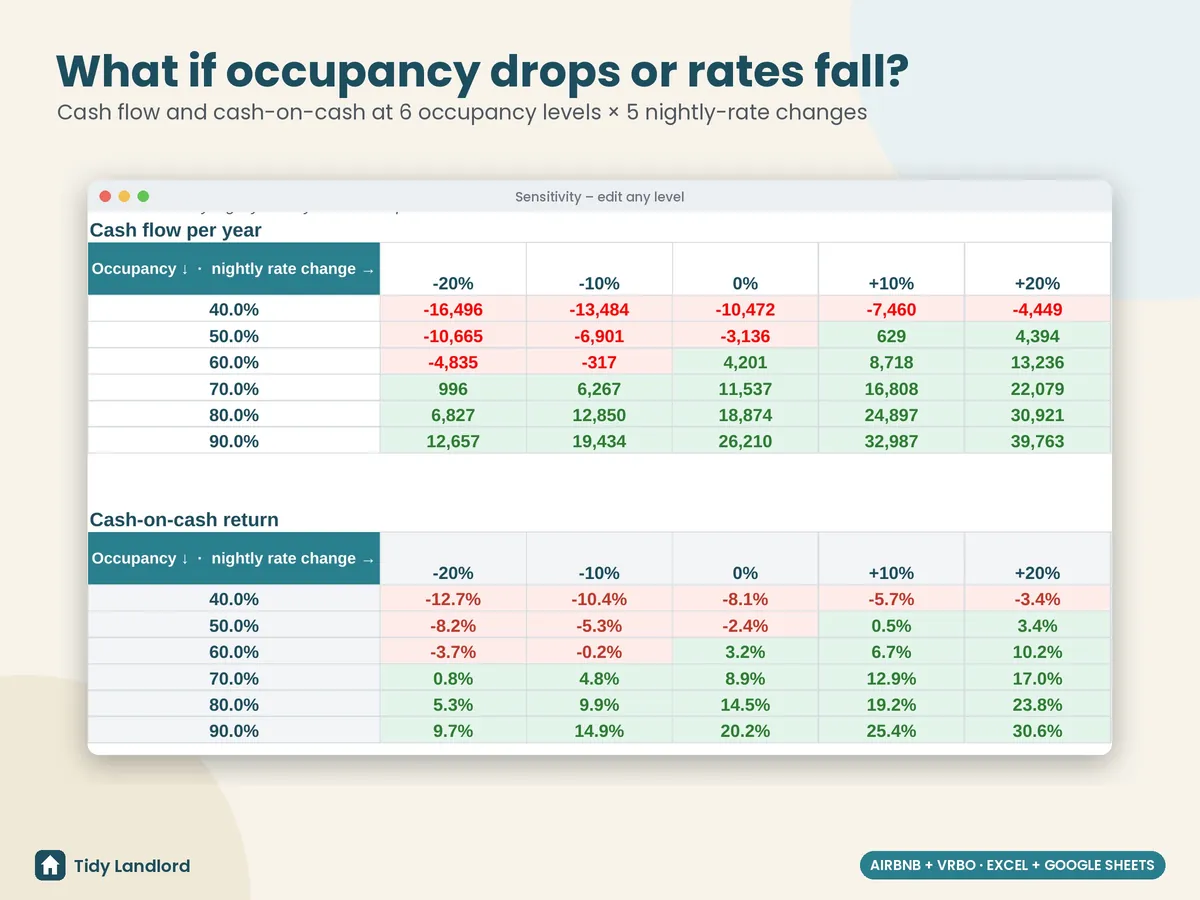
- Sensitivity: cash flow and cash-on-cash at 6 occupancy levels × 5 nightly-rate changes (every level editable), plus conservative / base / optimistic scenarios side by side
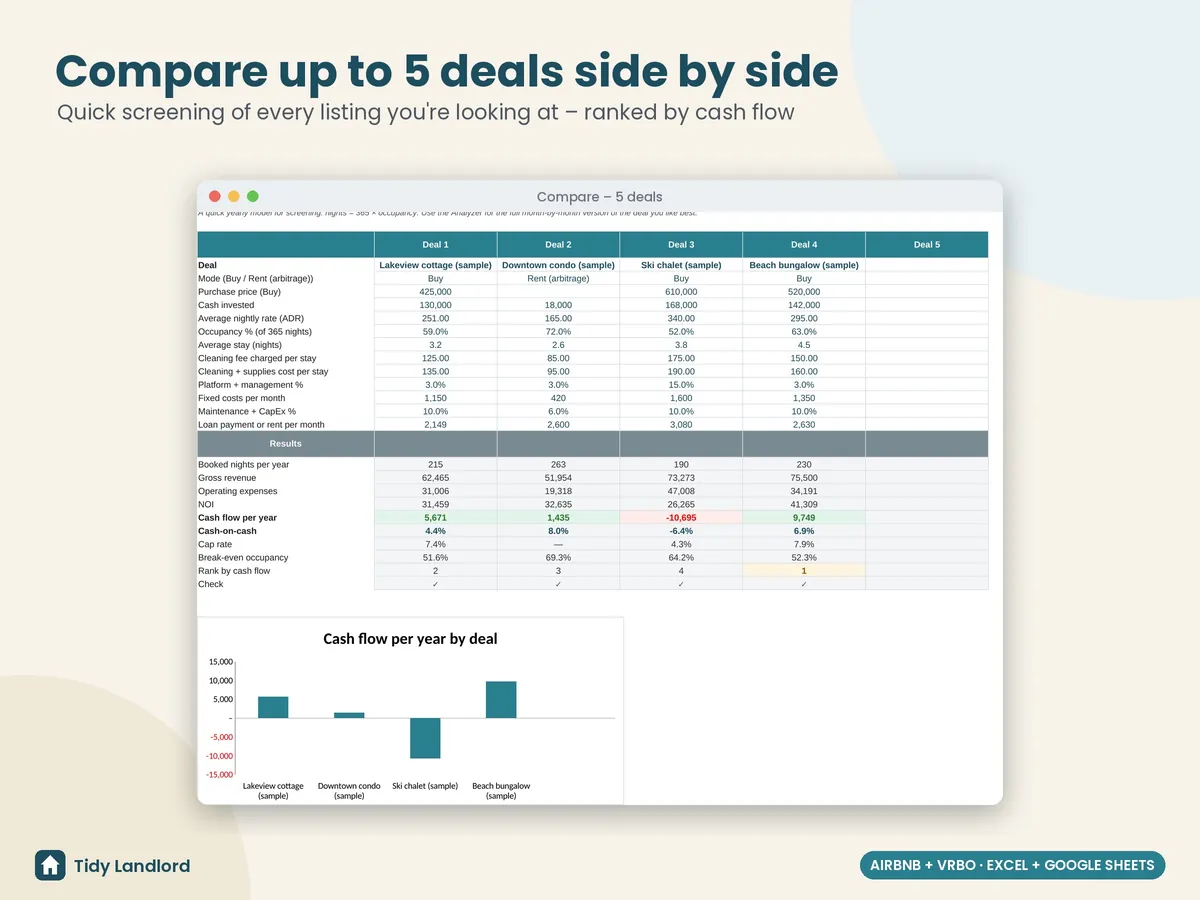
- Compare: a yearly side-by-side of up to 5 listings you're looking at (Buy or Rent): nights, revenue, operating expenses, NOI, cash flow, cash-on-cash, cap rate, break-even occupancy and a rank by cash flow, with a chart
- A dashboard with a one-line verdict, 10 key numbers, the month-by-month table and short-term vs long-term, with two charts
- Check columns that flag text in number cells, percentages over 100%, more blocked nights than days in the month, an occupancy without a nightly rate and more; the dashboard counts them for you
- A Start Here guide in plain English, to analyze your first deal in about 10 minutes
Details
- How the numbers work: booked nights = (days in the month − blocked nights) × occupancy; nightly revenue = booked nights × nightly rate; stays = booked nights ÷ average stay; platform fee = fee % × (nightly revenue + cleaning fees); NOI = gross revenue − operating expenses; cash flow = NOI − loan payments (Buy) or rent to the owner (Rent); cash-on-cash = cash flow ÷ cash invested; cap rate = NOI ÷ price; DSCR = NOI ÷ loan payments; break-even occupancy is where cash flow is 0 at your rates, stay length and seasonal pattern
- US monthly or Canadian semi-annual mortgage compounding; any currency label
- Excel 2010+ and Google Sheets, no macros, no add-ons, no subscription
- Tested formula by formula against an independent model (US and Canadian mortgages checked against standard payments, rental arbitrage, 0% interest, all-cash, no bookings, a losing deal, a leap year, cleared data and edge cases), in LibreOffice and live in Google Sheets
- For deciding before you buy or lease; once you're hosting, track real stays in the STR host tracker
Screenshots
How it works
- Buy on Etsy and download the .xlsx file.
- Open it in Excel, or upload it to Google Drive and choose File → Save as Google Sheets.
- Type over the clearly marked sample deal: the Analyzer first, then a nightly rate and occupancy for each month (comparable listings or a market-data tool are the best source), and read the Dashboard.
Bought it? Track real stays, fees and profit with the Airbnb & VRBO Short-Term Rental Host Tracker. Comparing a long-term rental instead? Use the Rental Property Investment Analyzer.
Free tool: Cap rate & cash-on-cash calculator
This is an estimating tool, not financial, investment, tax or legal advice: results are only as good as your assumptions, and short-term rental income is seasonal and can change quickly. Many cities, condo boards and leases restrict or ban short-term rentals, require a licence or permit, or cap nights per year: check the rules, and in rental arbitrage get the owner's written permission, before you commit. Income tax, occupancy / sales taxes on stays, depreciation, financing fees and rate changes at renewal aren't included. It was designed with the help of AI tools, then reviewed and tested before release.