Home › Portfolio & net worth dashboard
Investors & growing landlordsRental property portfolio & net worth dashboard
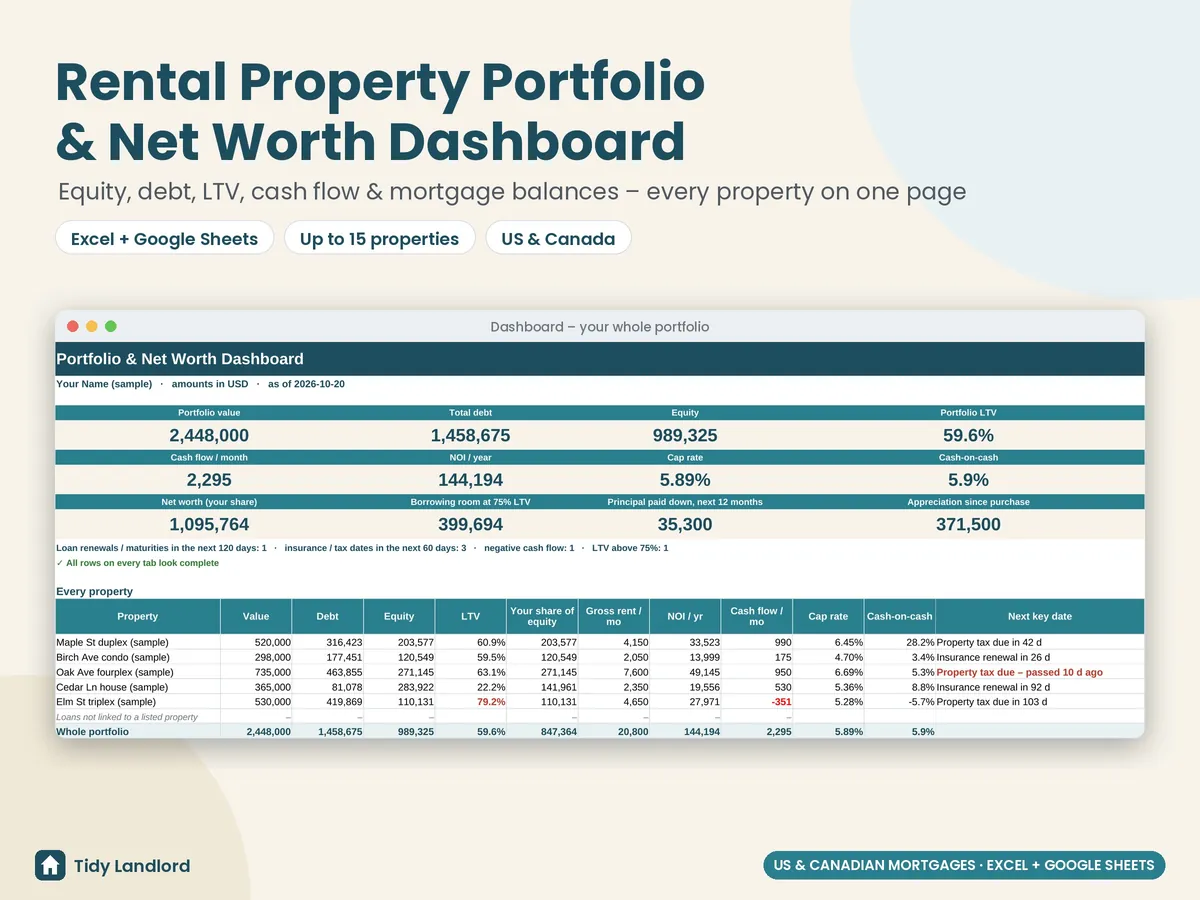
See your whole rental portfolio, and your net worth, on one page. A rental property portfolio tracker and net worth dashboard for landlords and real estate investors that works in Excel and Google Sheets. Enter each property and each loan once and it works out today's mortgage balances, equity, LTV, cash flow, cap rate and cash-on-cash return, for the US, Canada or anywhere else (the currency is just a label). Built for up to 15 properties and 30 loans (mortgages, HELOCs, private loans), with US monthly and Canadian semi-annual compounding.
Instant digital download (.xlsx). No macros, no subscription.
What you get
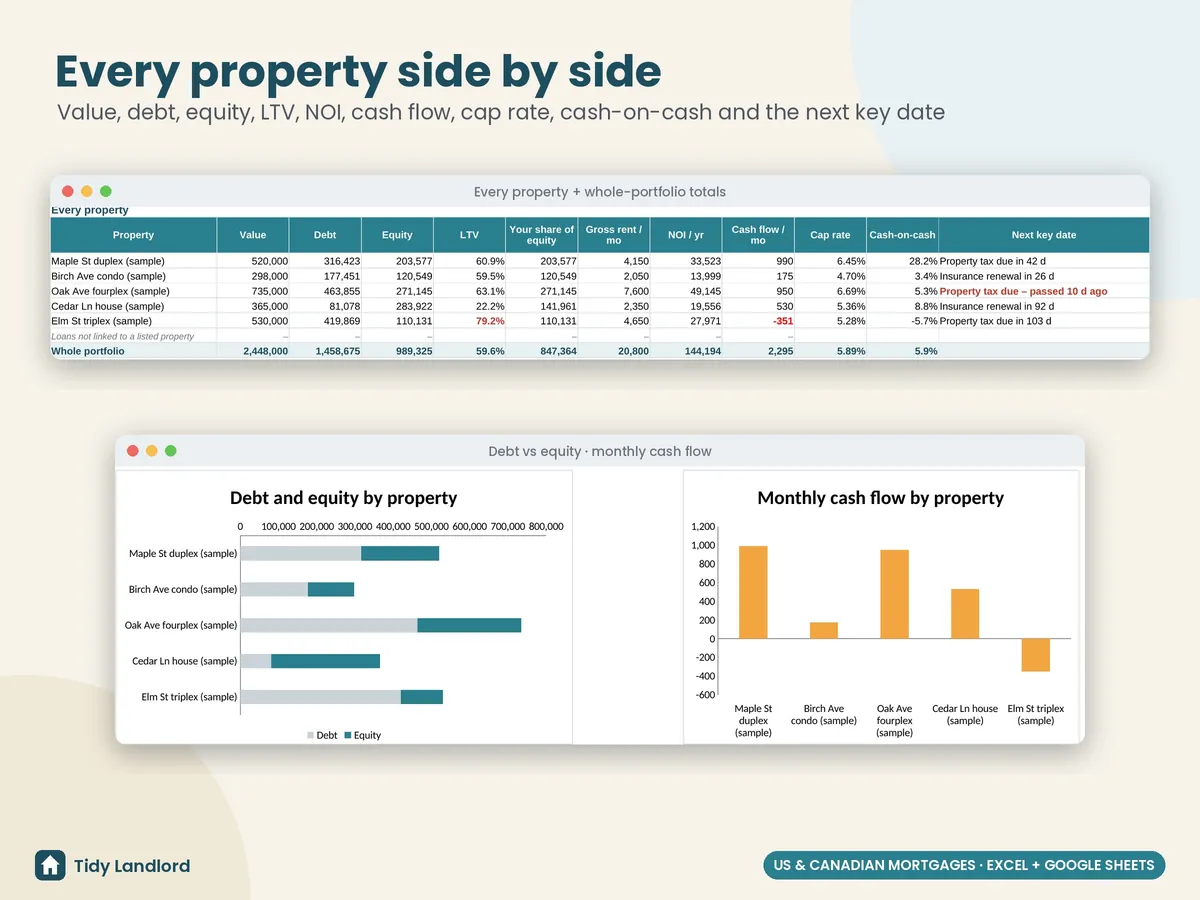
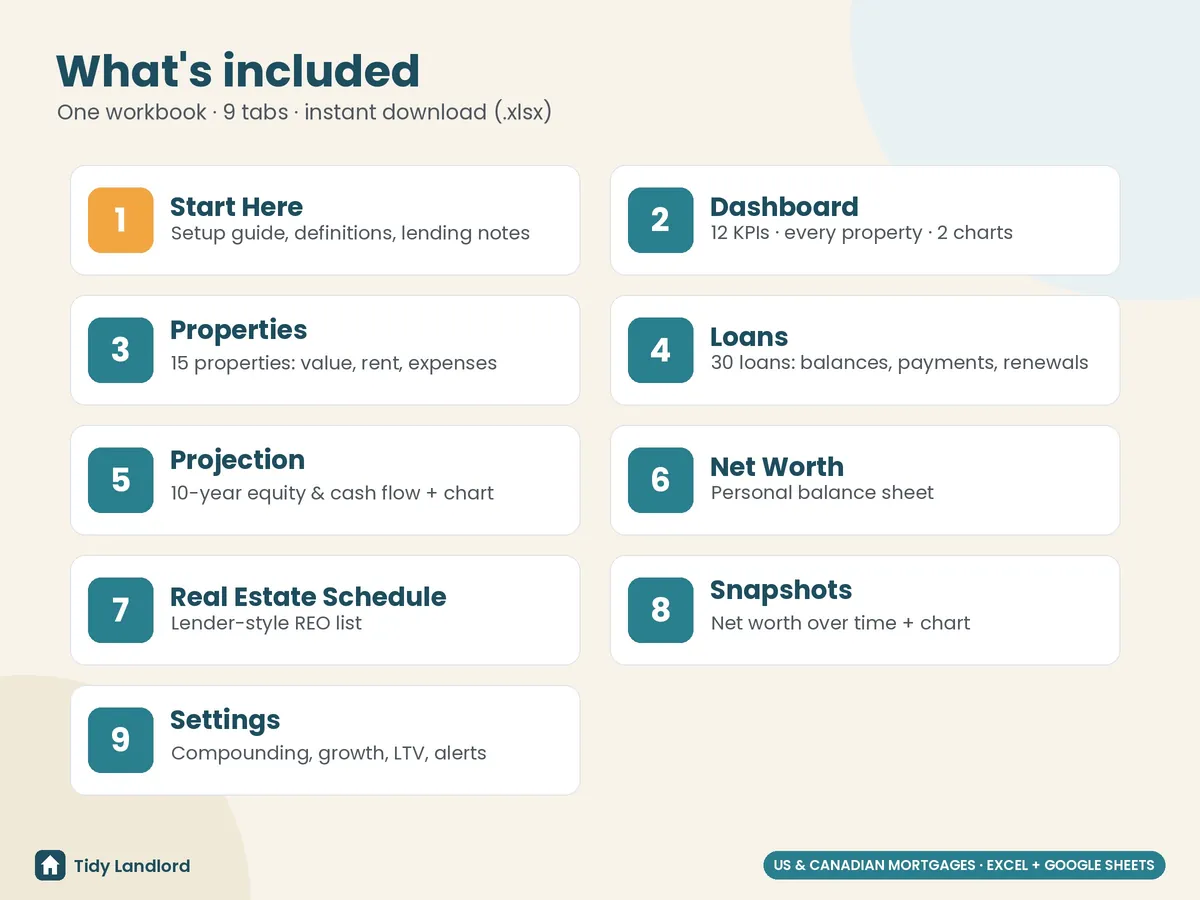
- A dashboard with 12 numbers at a glance: portfolio value, total debt, equity, LTV, cash flow per month, NOI, cap rate, cash-on-cash, net worth, borrowing room at your max LTV, principal paid down in the next 12 months and appreciation since purchase. Every property side by side with its next key date, plus a debt-vs-equity chart and a monthly cash flow chart
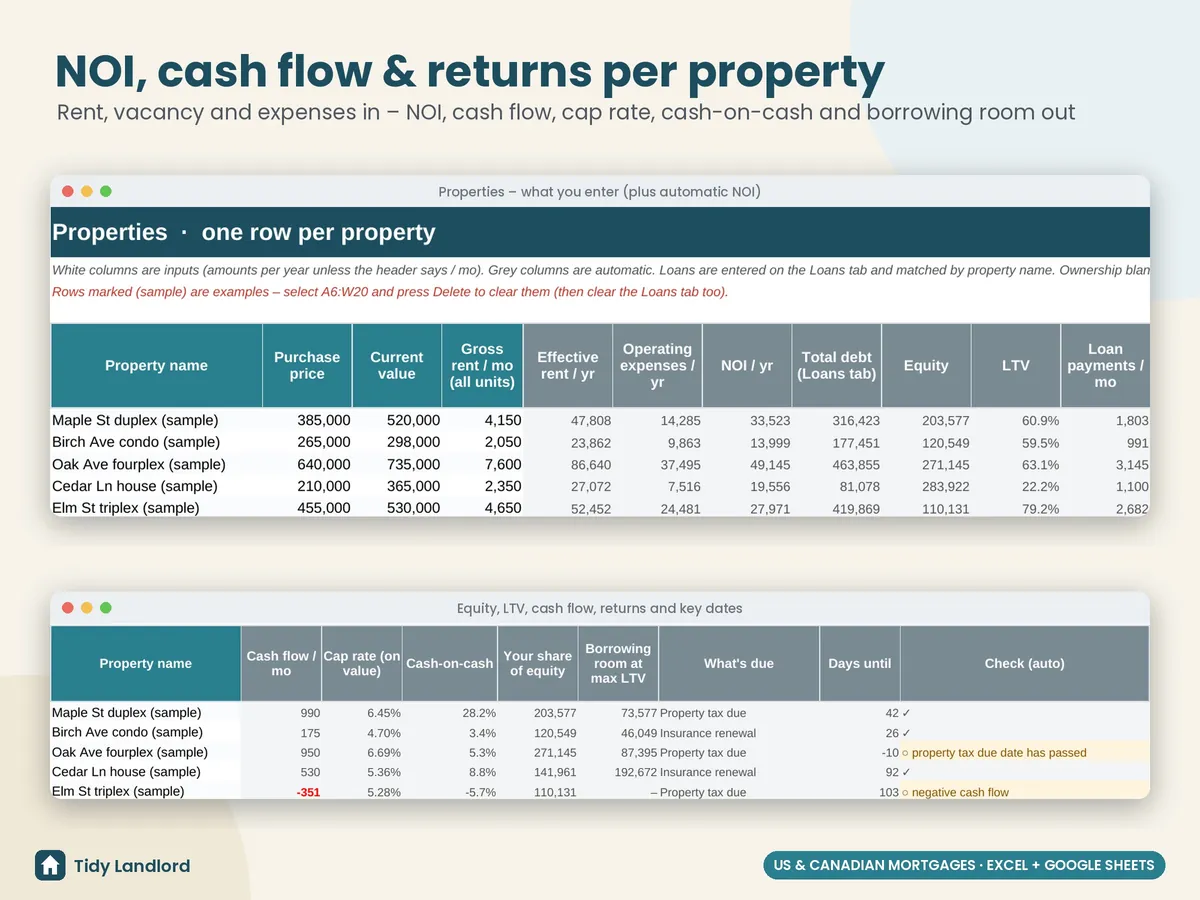
- Properties, one row each: type, units, purchase price and date, closing costs, improvements, today's value and where it came from, ownership %, rent, vacancy, taxes, insurance, HOA / condo fees, utilities, reserves, management, appreciation %, insurance renewal and property-tax due dates. NOI, cash flow, cap rate, cash-on-cash, equity, LTV and borrowing room are worked out for you
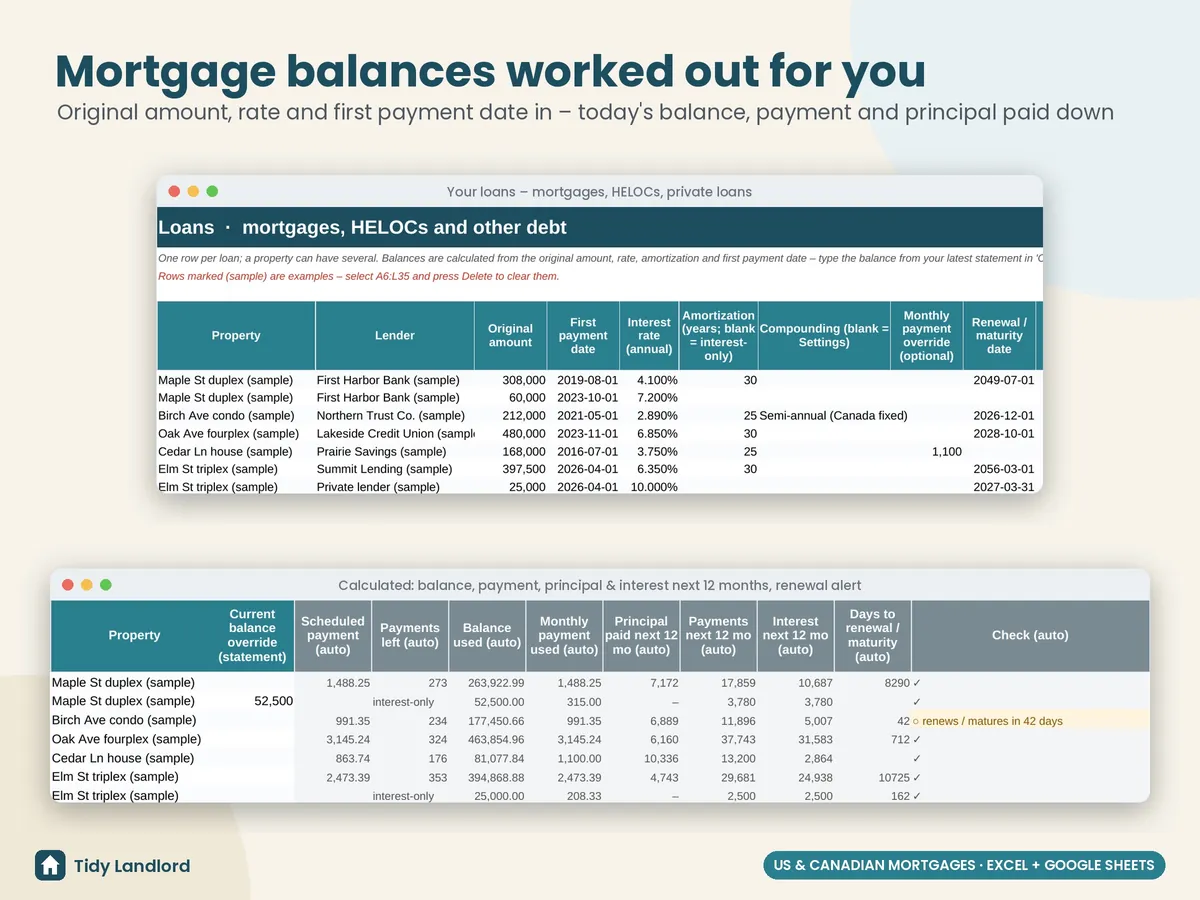
- Loans, one row each: lender, type, original amount, first payment date, rate, amortization (blank = interest-only HELOC), compounding and renewal / maturity date. Today's balance, payment, payments left, principal and interest for the next 12 months and days to renewal are calculated, or type the balance from your statement and it's used instead. Optional monthly payment override if you pay a different amount
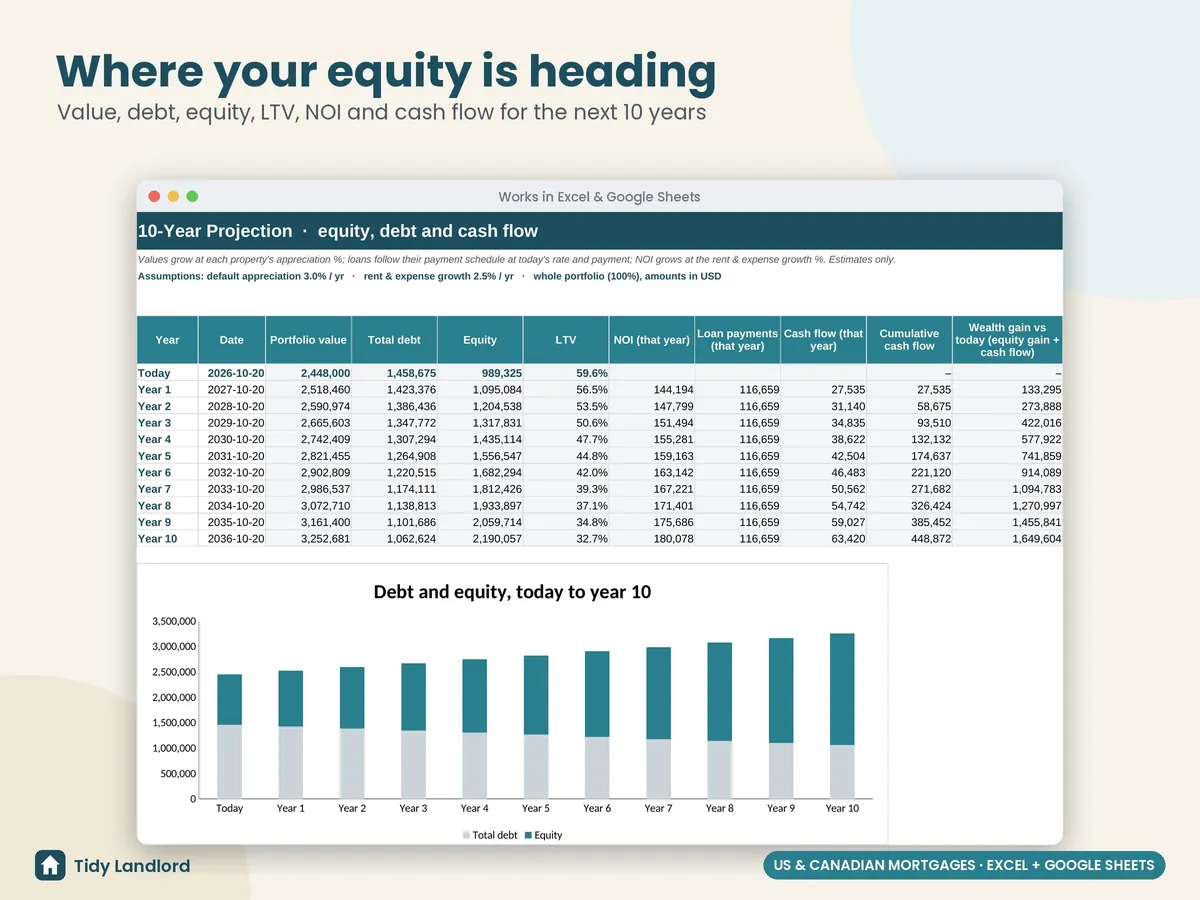
- A 10-year projection: value, debt, equity, LTV, NOI, loan payments and cash flow year by year, with a debt-and-equity chart
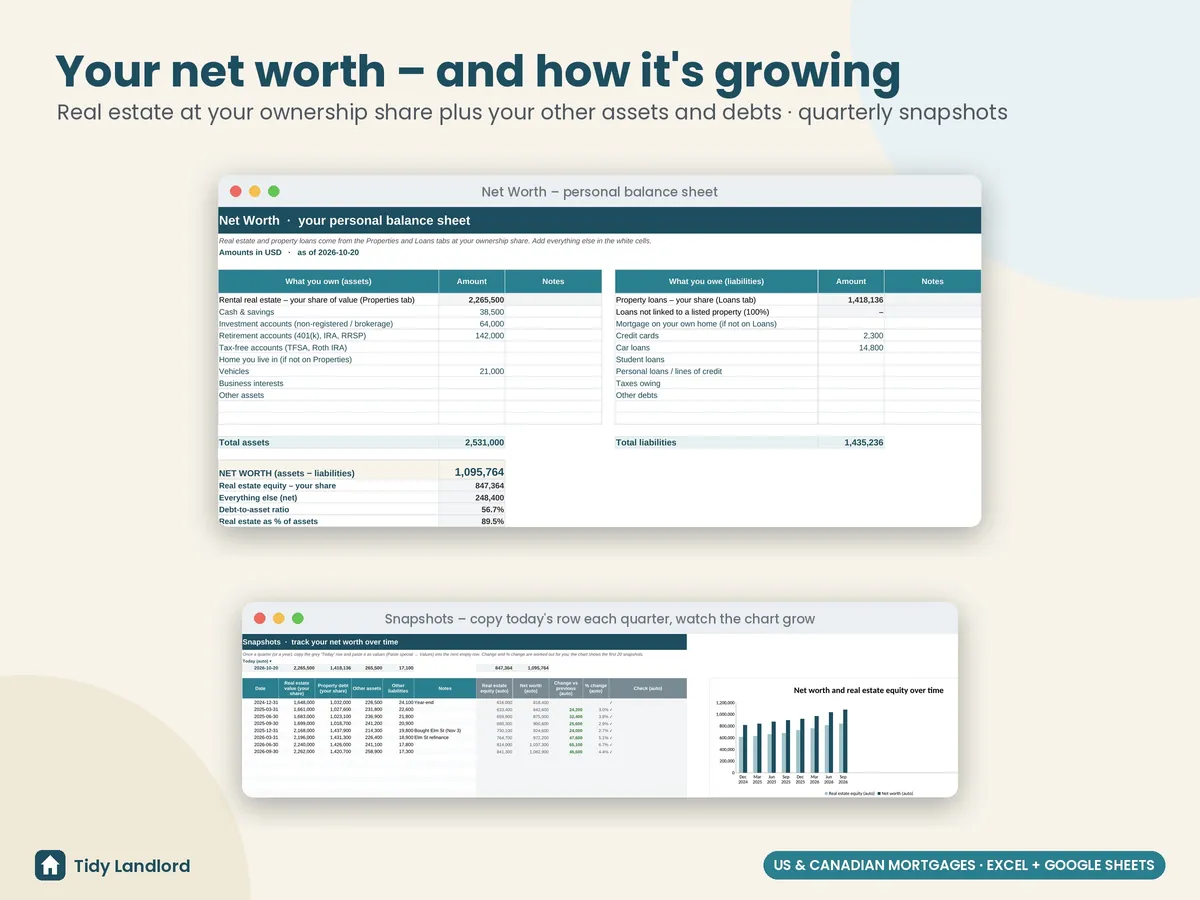
- Net worth: a personal balance sheet where your share of the real estate and property loans comes in automatically; add cash, investment and retirement accounts (401(k), IRA, RRSP, TFSA, Roth IRA), vehicles, business interests, credit cards, car and student loans. Shows debt-to-asset ratio and real estate as a % of assets
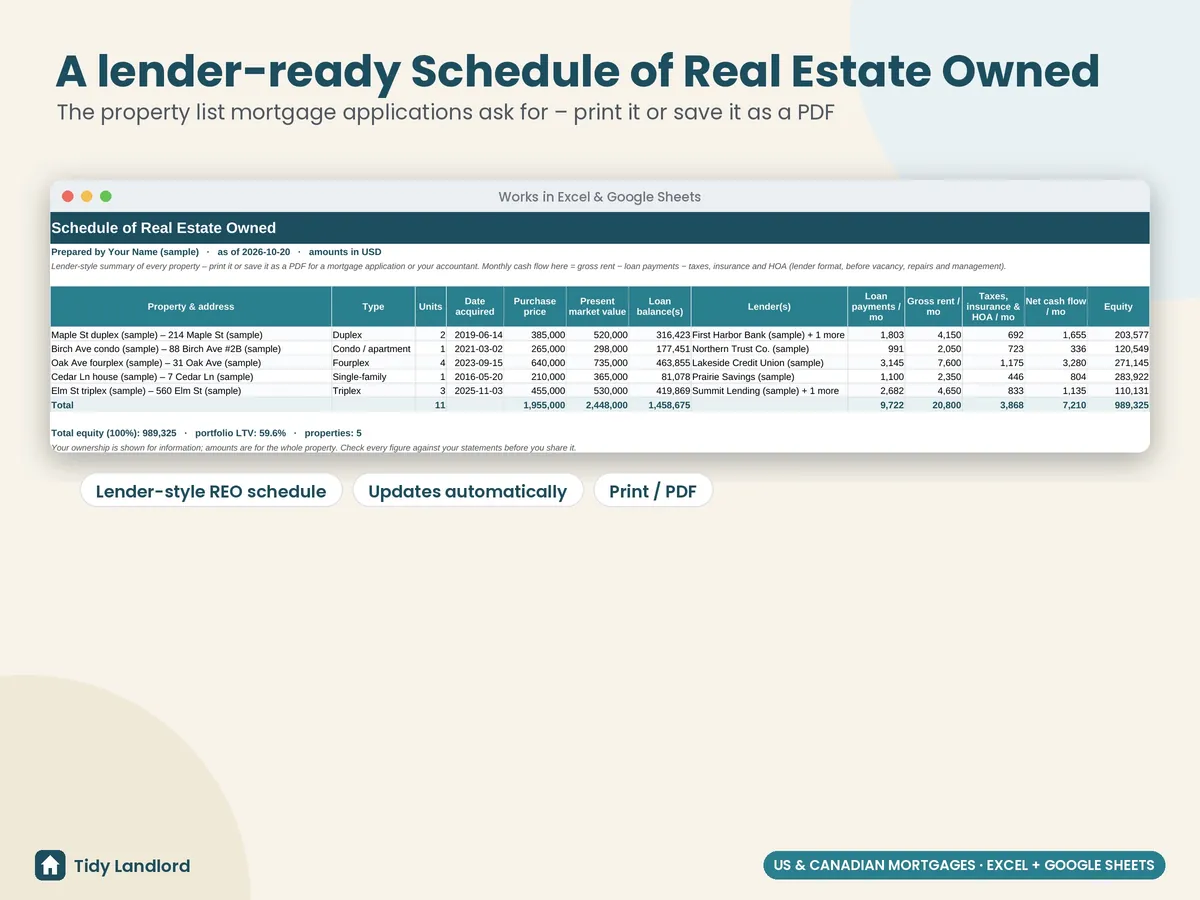
- A schedule of real estate owned: the property list mortgage lenders ask for (address, type, units, date acquired, price, value, loan balance, lender, payment, gross rent, taxes / insurance / HOA, net cash flow), ready to print or save as a PDF
- Snapshots: copy today's totals once a quarter and watch your net worth and equity grow (change, % change and a chart, up to 40 snapshots)
- Key date alerts: loan renewals and maturities (120 days ahead by default), insurance renewals and property-tax due dates (60 days), negative cash flow and LTV above your limit
- Check columns that flag missing names, duplicate properties, loans for a property that isn't listed, missing rates or dates and text typed into number cells; the dashboard counts them for you
- A Start Here guide with plain-English definitions, to set up in about 15 minutes
Details
- Up to 15 properties, 30 loans and 40 snapshots; works with any currency
- US monthly and Canadian semi-annual mortgage compounding; balances and key dates use today's date, or an as-of date you set
- Excel 2010+ and Google Sheets, no macros, no add-ons, no subscription
- Tested formula by formula against an independent payment-by-payment mortgage model, with sample data, cleared data, overrides, paid-off and future loans and edge cases, in LibreOffice and live in Google Sheets
- Not accounting or investment software, and not connected to any bank, lender or valuation service: values are what you enter
Screenshots
How it works
- Buy on Etsy and download the .xlsx file.
- Open it in Excel, or upload it to Google Drive and choose File → Save as Google Sheets.
- Pick your currency and compounding on Settings, delete the clearly marked sample data, and add your properties and loans.
Free tool: Mortgage payment calculator (US & Canada)
This is a record-keeping and estimating tool, not financial, investment, lending, tax, legal or accounting advice. Values, balances, projections and borrowing room are estimates based on what you enter: your lender's statement and an appraisal are what count, and borrowing room is not a loan offer. General notes only: Fannie Mae's eligibility matrix allows up to 75% LTV for a cash-out refinance of a 1-unit investment property and 70% for 2–4 units; in Canada, OSFI guideline B-20 limits the revolving HELOC part to 65% of the property value and federally regulated lenders cap uninsured borrowing at 80% in total; and the federal Interest Act requires blended-payment mortgages to state the rate calculated yearly or half-yearly, not in advance (which is why Canadian fixed-rate mortgages are usually compounded semi-annually). Lenders set their own rules and they change, so please check with your lender or a qualified professional. It was designed with the help of AI tools, then reviewed and tested before release.